Internal engineering
BugBot
Where it fits in Soundboard
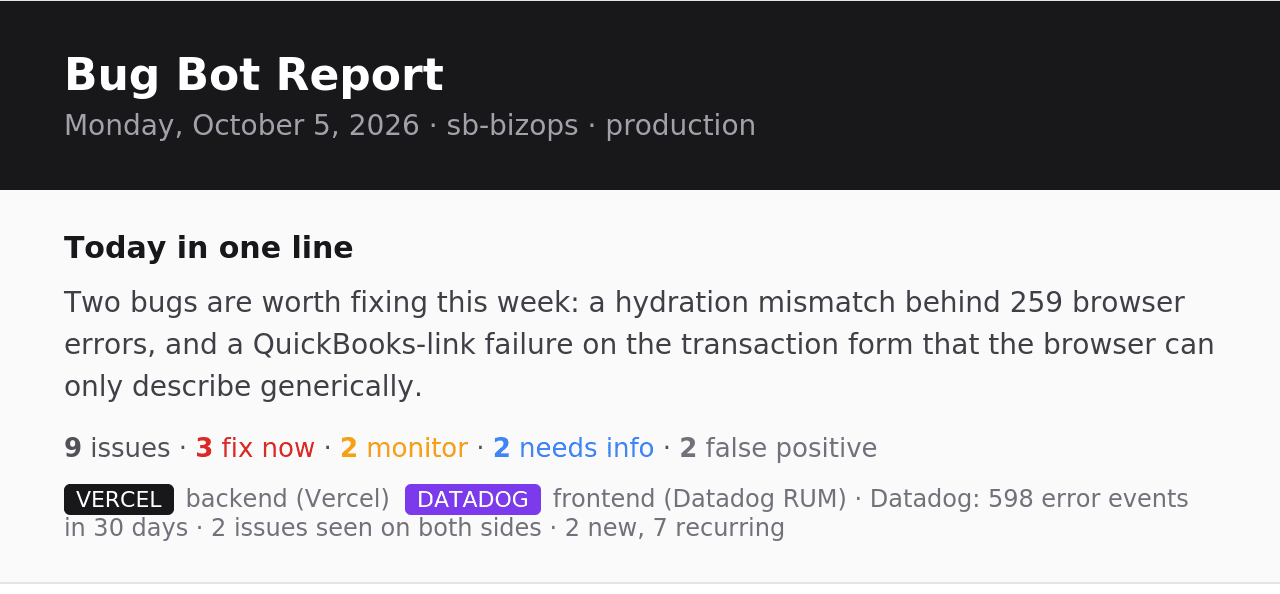
BugBot is internal tooling that watches Soundboard's production errors so I don't have to. Backend errors arrive from Vercel, where the Next.js app and its TypeScript backend run, and frontend errors arrive from Datadog. Every morning, a digest lands in my inbox with the previous day's issues sorted into four groups: fix now, monitor, needs more information, and false positive. Each issue comes with a likely root cause, a suggested fix, and the files to change, so I start the day knowing what to work on instead of digging through logs to find out.
Problem and origin
As Soundboard's only engineer, I'm also the only one watching production. An error nobody triages just stays unnoticed, and triage meant reading raw logs, working out which entries were the same bug repeating, and digging through the code for each one. That took 30 minutes to an hour of my day. I built BugBot in three days in early 2026, and the first digest went out on March 1.
Constraints
One noisy bug shouldn't bury ten quiet ones, so repeats of the same error have to be grouped, not counted as new problems. The analysis has to look at the actual code, not guess from the error message alone. And since I'm the only reader, the digest has to be short enough to read over coffee.
Architecture
BugBot works in two stages. As errors arrive, a TypeScript service groups them into clusters. Once a day, a scheduled run analyzes each cluster that had new activity and sends the digest. The model call itself goes through a small Python service, the same split every agent in Soundboard uses.
As errors arrive
continuous, TypeScript service
1. Receive
Vercel (backend) and Datadog (frontend) push errors over HTTP
2. Normalize
UUIDs, timestamps, URLs, IPs, ports, and tokens become placeholders
3. Fingerprint
Hash of message, top stack frame, project, error type, and route
4. Cluster
Same fingerprint, same cluster: the count goes up, nothing new is created
Every morning
scheduled run, Claude Sonnet 4.5 via the Python service
1. Pick clusters
Only clusters with new activity since the last run
2. Find the code
Search the repo for the [file:function] tag and extract the function
3. Analyze
One model call per cluster, with samples, code, and past analyses
4. Digest
Grouped by fix now, monitor, needs info, false positive; emailed
Stage 1: Grouping errors as they arrive
The same bug rarely produces the exact same message twice. Each occurrence carries its own record ID, timestamp, or server address, so a naive count would treat every one as a new problem. Before an error is stored, BugBot normalizes it, replacing everything instance-specific with a placeholder:
function normalizeMessage(message: string): string {
  return message
    .replace(/[0-9a-f]{8}-[0-9a-f]{4}-[0-9a-f]{4}-[0-9a-f]{4}-[0-9a-f]{12}/gi, '<UUID>')
    .replace(/\b\d{10,13}\b/g, '<TIMESTAMP>')
    .replace(/https?:\/\/[^\s"]+/g, '<URL>')
    .replace(/\b\d+\.\d+\.\d+\.\d+\b/g, '<IP>')
    .replace(/:\d+/g, ':<PORT>')
    .replace(/\b[A-Za-z0-9+/=]{20,}\b/g, '<TOKEN>')
    .trim()
    .slice(0, 500);
}
The normalized message is then combined with the top stack frame (function and file, without line numbers, so a small edit elsewhere in the file doesn't split a cluster), the project, the error type, and the route, and hashed into a fingerprint. Every error with the same fingerprint joins the same cluster and increments its count.
- Upload failed for doc 3f2a9c1e-8b4d-4e2a-9f1c-7d6e5b4a3c21 at 1727704931 (10.0.4.12:5432)
- Upload failed for doc a81c44d0-2e6f-4b1a-8c3d-0f9e8d7c6b54 at 1727705288 (10.0.7.3:5432)
One cluster
2 occurrences
A separate hash of each event keeps webhook retries from storing the same error twice, and emails, tax IDs, card and account numbers, and phone numbers are redacted before anything is saved. Across seven months, this turned 5,578 error events into 1,917 clusters, so the analysis works on about a third as many items as there are raw errors.
Stage 2: Finding the code behind an error
An error message alone rarely says enough to diagnose a bug, and frontend errors in particular
often say almost nothing. So I made every error in the codebase say where it came from: each
error message carries a tag in the form [file:function]. It's a convention I applied across the
app, and 791 error-emitting call sites carry one.
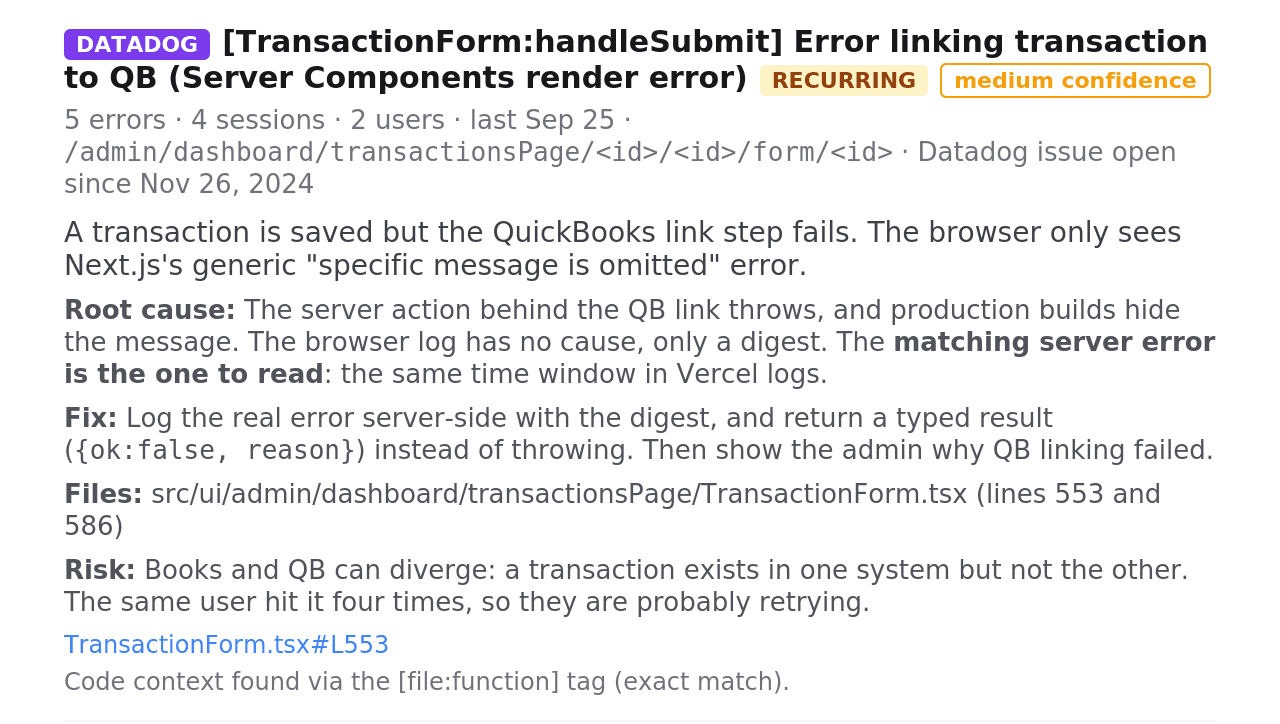
When BugBot analyzes a cluster, it searches the repository for that tag, fetches the file, and extracts the function, capped at 5,000 characters. Here's what that buys. This error came from the browser, where Next.js replaces the real message with a generic one in production builds:
[TransactionForm:handleSubmit] Error linking transaction to QB Error: An error occurred in the Server Components render. The specific message is omitted in production builds...
The message itself is useless, but the tag still leads straight to handleSubmit in the
transaction form. With the code in hand, the analysis worked out that the QuickBooks linking step
was failing after the transaction saved, and suggested returning a typed result instead of
throwing, so the admin can see why linking failed.
Tagged errors find their code about 90% of the time. Errors without a tag, mostly browser errors from third-party code, fall back to a keyword search, which brings the overall rate to 85%. If the lookup fails or GitHub is unavailable, the analysis runs without code instead of stopping.
Stage 3: The morning analysis
Each morning, a scheduled job analyzes every cluster with new activity, making one model call per cluster rather than one per log line. The prompt gives the model what a person would want before diagnosing a bug:
- The cluster's summary: how many times it happened, when it started, and where
- Up to three sample logs with their stack traces
- The code found through the tag
- Up to three earlier analyses of the same cluster, so the model knows what it concluded last time
Claude Sonnet 4.5 returns a root cause, one of the four action groups, a confidence level, a suggested fix, the files to modify, a risk assessment, and a one-line summary for the digest. Each run costs about 22 cents.
One cluster, end to end
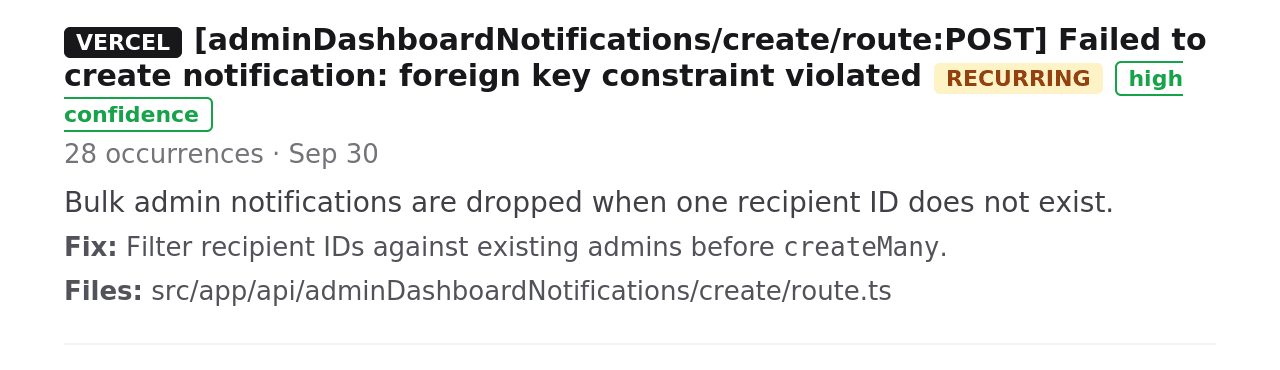
On September 30, the same error appeared 28 times in seven minutes:
[adminDashboardNotifications/create/route:POST] Failed to create notification: Foreign key constraint violated
All 28 landed in one cluster, and the next morning's digest put it under "fix now" with high confidence. The analysis: the bulk insert had received a recipient ID that no longer existed, and one bad ID aborted the whole batch, so every recipient lost the notification. It suggested filtering recipient IDs against existing admins before the insert, named the one file to change, and assessed the risk as silent data loss: nothing on screen broke, so admins simply never got their alerts. That's exactly the kind of bug that goes unnoticed without something watching.
Reading the digest
The four groups are what make the digest fast to read. "Fix now" is the only group that needs action today; the rest tell me what to keep an eye on, what to investigate, and what to ignore.
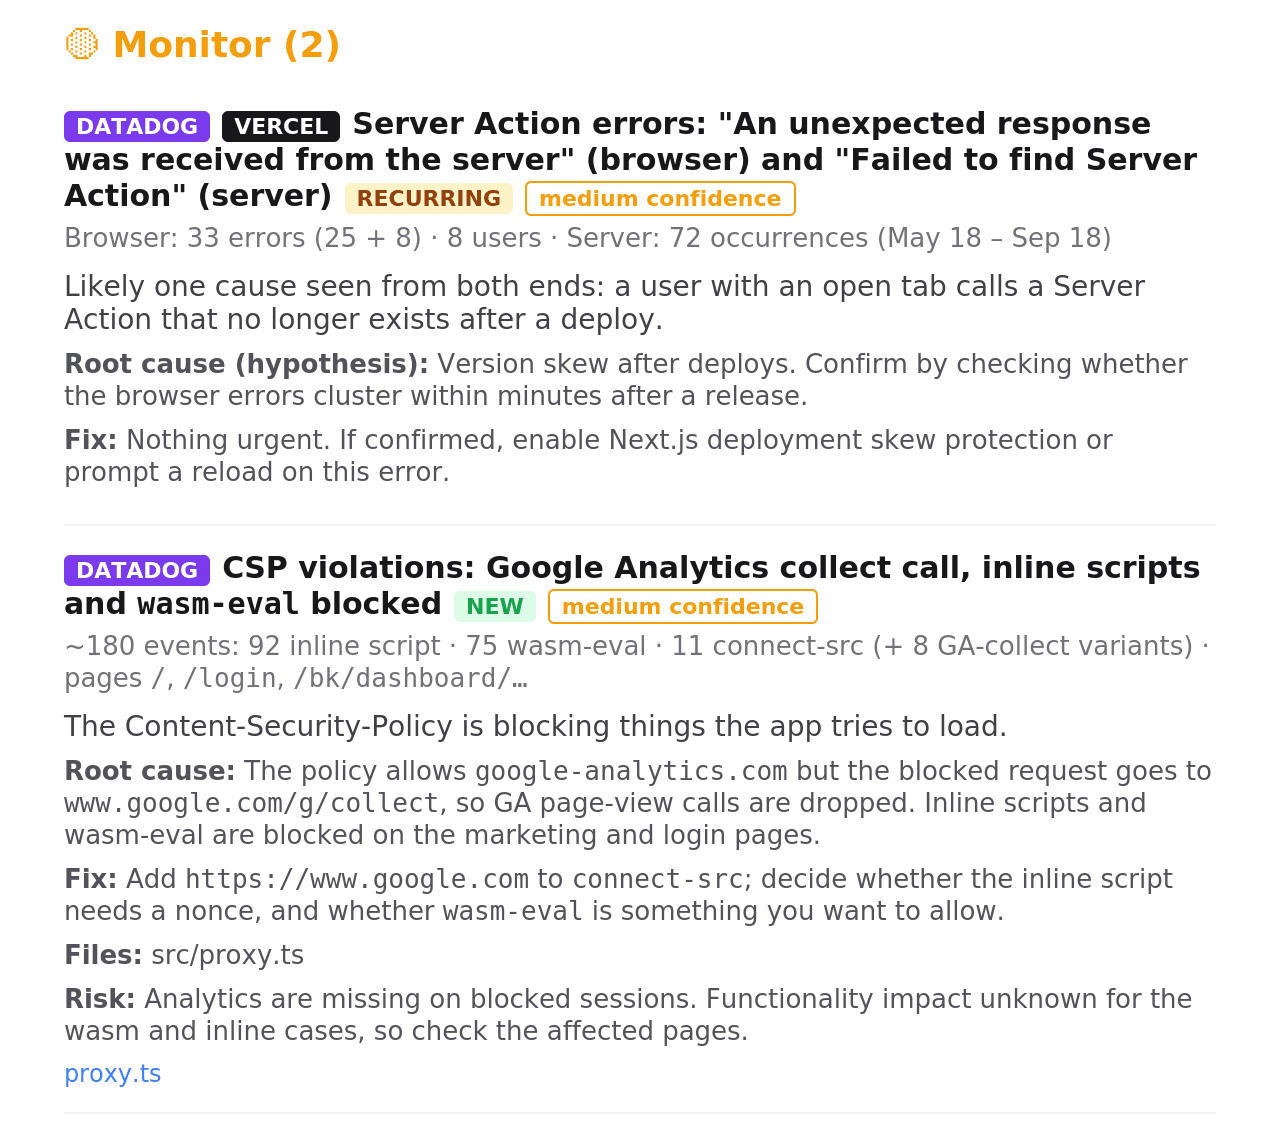
Monitor is for issues that are real but not urgent. In this example, BugBot connected a browser error and a server error that come from the same cause, a user with an open tab calling code that a new deploy has replaced, and suggested a way to confirm it before doing anything.
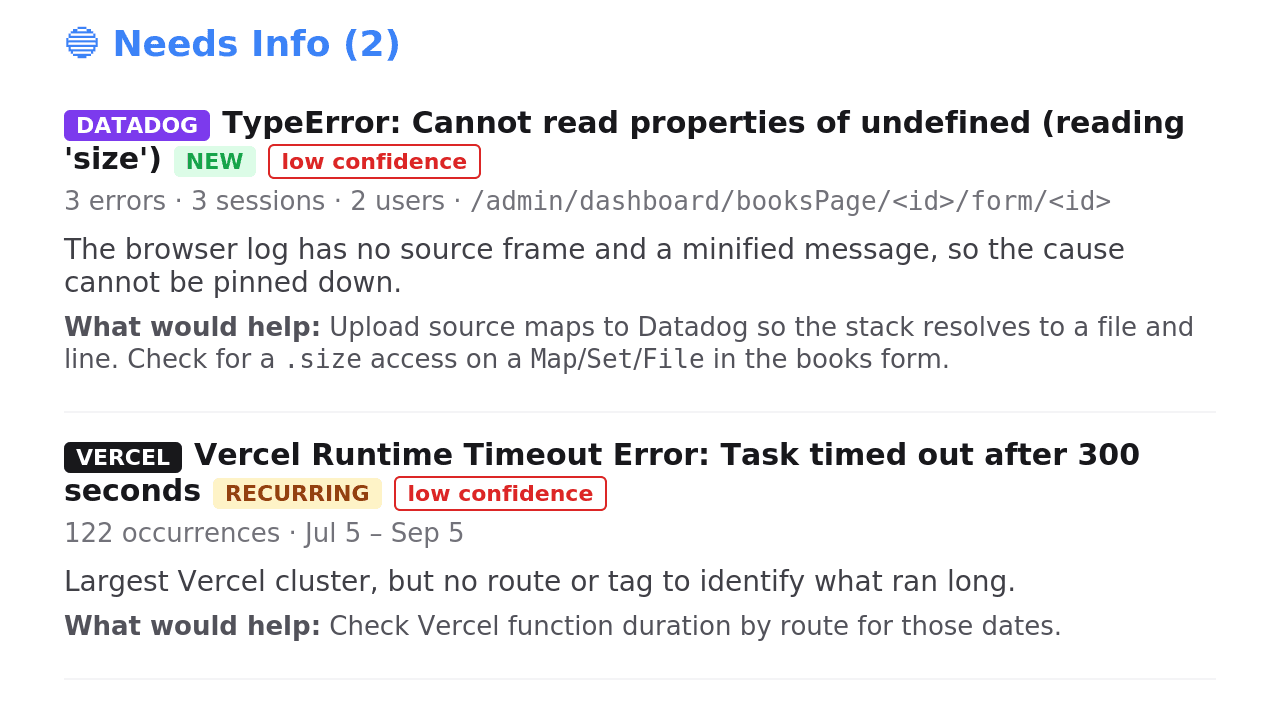
Needs info is for errors BugBot can't diagnose with what it has. Instead of guessing, it marks them low confidence and says what would help, such as uploading source maps so a minified browser error resolves to a file and line.
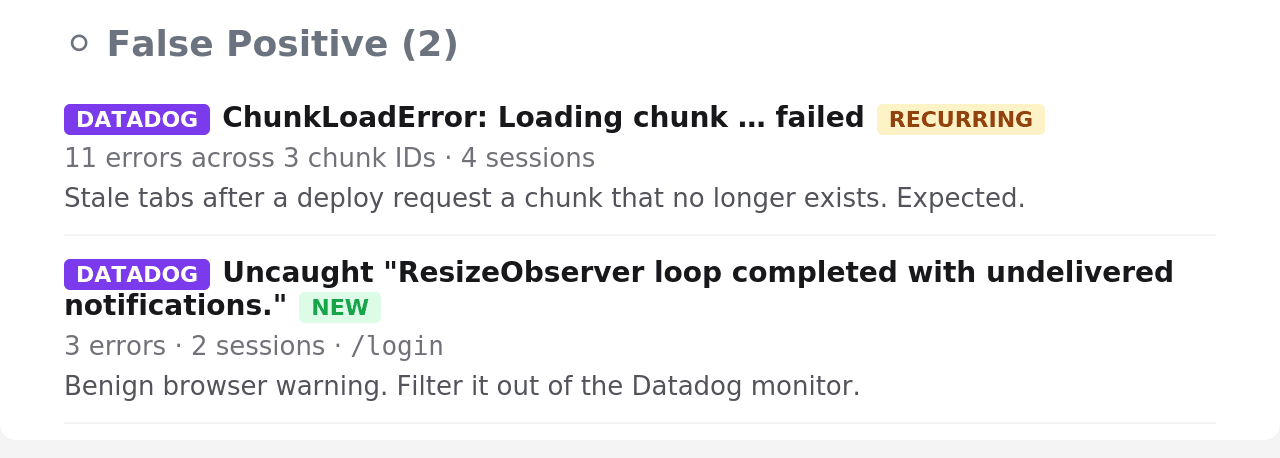
False positive is for noise: expected errors like stale browser tabs requesting files from a previous deploy, or harmless browser warnings, along with a note on how to filter them out at the source.
Key decisions and tradeoffs
Analyze clusters, not logs. Analyzing each cluster once a day, instead of each log as it arrives, keeps cost low and keeps the same bug from appearing in the digest over and over. The tradeoff is latency: a new bug surfaces the next morning, not the moment it happens.
Make the errors work for the tool. Rather than making the analysis smarter at guessing where an error came from, I made every error say where it came from. A tag in the message costs nothing at runtime and turns a vague search into a direct one.
Give the model its own history. Including earlier analyses of a cluster means a recurring bug gets a consistent diagnosis instead of a fresh guess each morning, and a changed conclusion stands out.
Never block on missing context. If the code can't be found, the analysis still runs. A digest with less context is more useful than no digest at all.
Results
- Running every morning since March 1: 205 daily runs, 2,901 cluster analyses.
- 5,578 error events grouped into 1,917 clusters.
- About 22 cents per run, roughly $46 in model usage in total.
- My time to fix production errors down about 30%, by my estimate.
What I'd do differently
I'd derive error locations instead of writing them. The [file:function] tags are what make the
code lookup work, but they have to be maintained: rename a function and its tag quietly points
nowhere, and the lookup still goes through code search. Mapping production stack traces back
through source maps would give the exact file and function for every error, with nothing to keep
in sync.
I'd also measure whether the analysis is right. Nothing records whether a root cause or action group turned out to be correct. Since I'm the only reader, a one-click "right" or "wrong" on each item in the digest would be enough to measure it and catch a prompt change that makes things worse.